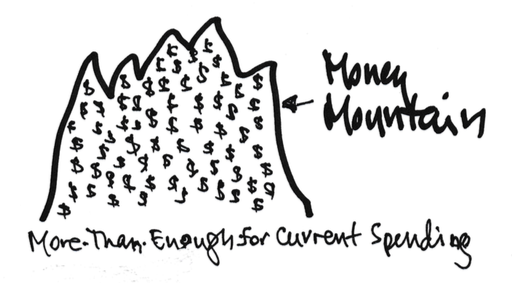
Tell me again: why do Patti and Tom have this mountain of cash that is More-Than-Enough for current spending?
Posted on December 29, 2017

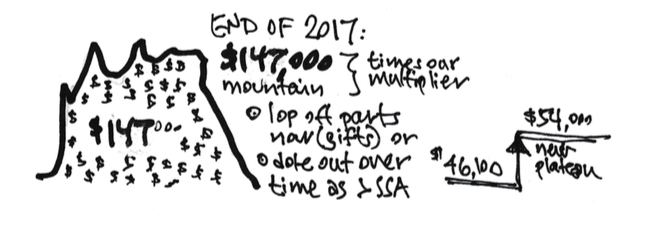
In our Recalculation the first week of December, Patti and I found that we had far more than enough to support our current spending. A small mountain of cash: +$147,000 per $1 Million starting Investment Portfolio (December 2014). And a calculation of a new Safe Spending Amount (SSA) of $54,000. (I have to use the multiplier I set in December 2014 to get to the grand totals.)

You also have a similar mountain of cash if you are just reasonably close to the correct decisions of How Much to Spend and How To Invest. But I’m guessing you don’t exactly understand this. You can only quantify the size of your mountain when you know how to Recalculate. (See Nest Egg Care, Chapter 9.)
Let’s just review. How did Patti and I get our mountain of cash again? Why is it we can increase our Safe Spending Amount by so much? It may be easier to look at this over a three-year time period rather tracking changes year-by-year.
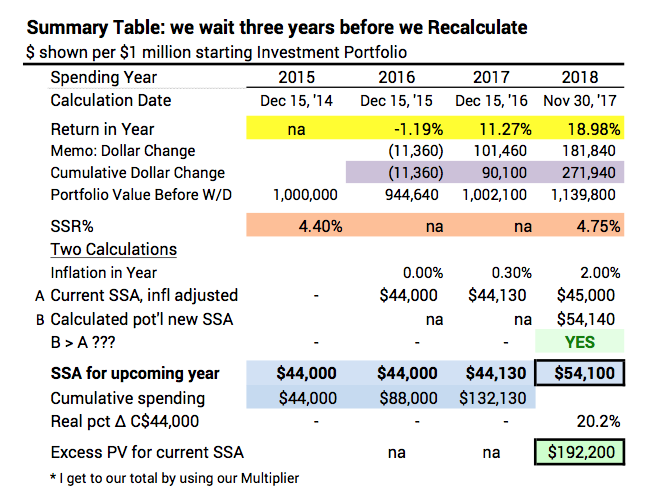
Let’s assume that Patti and I waited three years for our first Recalculation: start in December 2014 and now Recalculate in December 2017. In December 2014 we started with a Safe Spending Rate (SSR%) of 4.40% and applied that to $1 million Investment Portfolio. That gave us $44,000 per $1 million as our Safe Spending Amount (SSA) for 2015, and I’d use our multiplier calculated then to get to the total. That $44,000 is a constant dollar spending amount that does not change (only adjusts for inflation) independent of our portfolio value.
I’ve abbreviated the complete Recalculation sheet for the three years assuming we made no real changes to spending in 2016 and 2017. We only inflation adjusted the initial $44,000. That’s the three-year series of $44,000, $44,130, and $45,000. (That’s the row beginning “A Current SSA …”)

The sheet shows we now have $192,200 (outlined green cell) More-Than-Enough for our constant dollar spending amount adjusted for inflation – $45,000. We could lop off that $192,000 for gifts, for example, or we could dole that out over time as an increase to our new constant dollar Safe Spending Amount of $54,100 (outlined blue cell). Or, some combination of the two.
Why is this increase so big? What happened? Two factors are at play here.
• The first obvious factor is the series of returns we rode was clearly not a track of most HORRIBLE ever. Over the three years (for spending years of 2015, 2016, and 2017) we withdrew a total of +$132,000 (row highlighted in blue), but our total return over the period was ~$272,000 (row highlighted in purple). We obviously have more that we started with, about $140,000 or about 14% more (See row below the purple).
(Stock returns in particular were above their long run average rates for the three years. Stock returns averaged about 11% per year relative to their long-run real return rate of about 6.4% per year.)
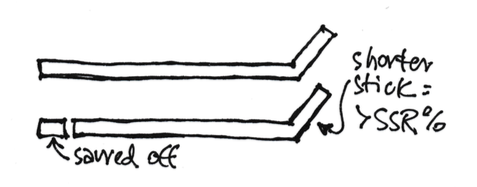
• The less obvious second factor is that we are older; we are three years (approximately) closer to the end of our journey. We, therefore, logically don’t need to plan to have our money last as long as we did before. In terms of the hockey stick, we don’t need one with as long of a shaft length – as many years of zero probability of depleting. We can take the current stick we’ve been using and saw off a little bit. A shorter stick has a greater SSR%. (Recalculation steps in Chapter 9 in Nest Egg Care tell you if it’s Okay to saw off a bit or not.)

For Patti and me at the end of 2017, our shorter, applicable stick (SSR%) – based on Patti’s age and life expectancy for the probable shorter journey – is 4.75% (That’s from the Data Table in Appendix D in Nest Egg Care.), not 4.40% that we started with in December 2014.
That .35% seems like a small change, but it’s is an 8% increase in our SSR% over the three years (.35%/4.40%). This 8% increase has two effects.
• We use the inverse of our SSR% is to find the amount we need for a given level of spending: at SSR% of 4.40% we needed 22.7 times a given spending level; at SSR% of 4.75% we need 21.1 times. For Patti and me at the end of 2017, I multiplied 1/4.75% times $45,000 – this is 2017 spending adjusted for inflation. That calculates to $947,600 needed for the $45,000, but we have $1,139,800. We have $192,200 More-Than-Enough.*
• Or we apply the 8% boost in our SSA to our portfolio value right before our withdrawal for next year. I multiply the 4.75% SSR% and the $1.14 million portfolio value to get to a new SSA of $54,100. That’s 23% greater than our initial $44,000 (some of which is inflation). We’d get to that same percentage increase by just dealing with the percentage changes: 8% greater SSR% applied to the 14% greater portfolio value. Using inflation adjusted results, 40% of our increase is due to an increasing SSR% and 60% of our increase is due to favorable returns.
Conclusion. Each of two factors work to calculate that you have More-Than-Enough for your current spending. And when you have More-Than-Enough for your current spending, you know you can increase your Safe Spending Amount (SSA).
The first obvious factor is favorable returns – returns that exceed withdrawals rates are obviously favorable. The second less obvious factor is the potential to use the greater SSR% applicable to our age (and its decreasing inverse).
* You may notice that the $192,000 calculated here is much greater than the $147,500 that I calculated for Patti and me when we recalculated annually. That’s because we paid ourselves more in 2017 from the Recalculation. That greater amount in “A Current SSA, infl adjusted” was $47,000, not $45,000. The use of the 21.1 (inverse of the 4.75% SSR%) to that $47,000 worked out less More-Than-Enough.