FIRECalc vs. the 4% Rule: Which One Wins?
Posted on August 3, 2018
FIRECalc wins. FIRECalc gives us retirees the right data for the key decisions we must make for our retirement plan. My independent calculations agree with FIRECalc’s and not with those from the 4% Rule. I am more confident that Patti and I have a solid financial retirement plan. I am not going to use any information or recommendations from the 4% Rule.
Why did I want to independently verify FIRECalc? Hey, my name is Tom, so I’m naturally a doubting Thomas. I like to dig and see the evidence to understand and verify things for myself. But the real impetus was an article (Sorry: you may face a paywall.) and interview that more specifically described something called the Updated 4% Rule. (Here’s the wikipedia entry on this.) The statements for the Updated 4% Rule were these (my summary):
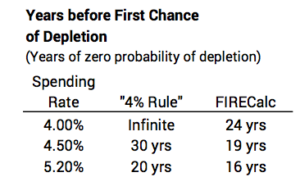
• A 4% spending (or withdrawal) rate is forever: no chance of ever depleting a portfolio
• A 4.5% spending rate is zero chance of depletion for 30 years
• A 5.2% spending rate is zero chance of depletion for 20 years.
NONE OF THOSE STATEMENTS ARE TRUE when I use FIRECalc (or the Vanguard RWC). Those spending rates are too high for safety – the stated years of zero chance of depletion. For example, FIRECalc would show 4.5% spending rate results in no chance for depletion for 19 years (not 30) and a 16% probability of depletion at the 30-year mark (not 0%).* That’s a wide disagreement. Which one is correct?
=======
I wanted to confirm the results of FIRECalc. Specifically, I wanted to confirm the decisions Patti and I made at the start of our retirement plan in late 2014. That was for our first spending year of 2015. Patti and I then chose 19 years as the number of years we wanted for zero probability of depleting our portfolio. (Chapters 3 and 4, Nest Egg Care [NEC], explain why we chose 19 years.)
FIRECalc told me the spending rate for 19 years of zero chance of depletion is 4.40% given two other plan inputs. A 4.40% rate translates to an annual, constant-dollar withdrawal for spending of $44,000 per $1 million Investment Portfolio; see Chapters 1 and 7, NEC. FIRECalc’s 4.4% is not close to 5.2% that the Rule would say. Who’s right? [Read here if you want to use FIRECalc to confirm those 19 years.]
========
How did I independently verify that FIRECalc’s 4.40% spending rate gave Patti and me 19 years with no chance of depleting?
First I built a spreadsheet with the correct logic or calculation steps of how a Retirement Calculator should work. I describe the logic of how an RWC works in Chapter 2 NEC and here.)
Next I had to get the historical annual return rates for stocks and bonds. A book in my library gives real (inflation adjusted) returns for stocks and bonds from 1926. Using real returns makes the calculations and math of an RWC (and my spreadsheet) much easier. Also, the RWC and my spreadsheet then calculates future portfolio value in constant spending power, and that’s what we want to understand.
I then had to find the most horrible sequence of returns ever. I could eyeball all the years and sequences, but it was easier to see return patterns by first plotting cumulative returns for stocks and bonds. (See here and below.)
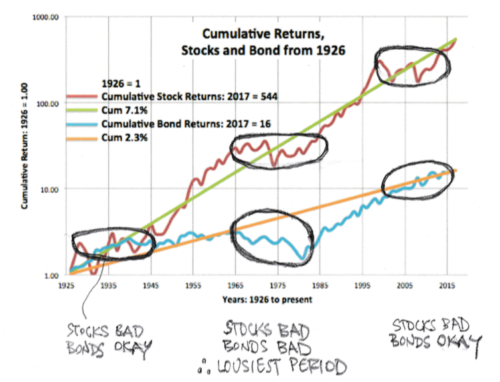
You can see three periods of lousy stock returns. The trend line heads northeast, but the actual generally wanders directly east for a number of years (0% cumulative return) with a number of years of steep declines heading deep south. The worst and longest period started in the mid-1960s. That period contains the second worst two-year return for stocks in history: the cumulative, real decline was -49% for 1973 and 1974. It took 17 years for cumulative stock returns to get back to the January 1, 1966 level.
Bonds were also lousy (their lousiest) for that period. They turned southeast in 1965 and continued southeast. Returns improved dramatically starting in 1982, but cumulatively returns did not get back to the 1965 level until 1986.
Finally, I needed to find the specific, worst-start year. To do that I pasted 30-year series for returns for stocks and bonds for each start-year in the 1960s and early 1970s into the spreadsheet. I could see the effect using 4.40% spending rate. I found the stinker year for the start was 1969. The start gave the fewest years to the first chance of depletion. That is the very bad starting point for both stocks and bonds: 1969 was start of the worst six-year cumulative stock return in history, and bond returns for the next 12 years contain four of the worst ten since 1926.

========
With FIRECalc’s default .18% Investing Cost and our decision on Mix, the resulting spreadsheet gives 20 years of zero chance of not being able to take a full withdrawal for next year’s spending (See here for full view.) I judge the spreadsheet’s 20 years vs. FIRECalc’s 19 years is of no consequence. The spreadsheet supports the Safe Spending Rate I get from FIRECalc. It does not support what I’d get from the 4% Rule.
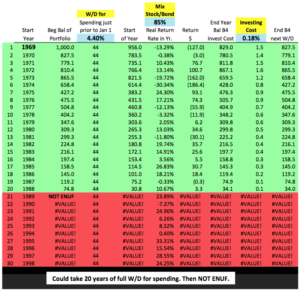
I like the fact that my spreadsheet calculates one year more of no chance of depletion for our starting 4.40% spending rate. That indicates our plan might be a shade more conservative than I thought. (When I use our actual Investing Cost of .07%, I increase portfolio value by enough at the end 20th year to tip the result to an added year of full withdrawal for spending [See here]. I did not include the impact of using our off-the-top Reserve in a year of horrible returns (See Chapter 7); that would add several more years [I don’t display this result].)
This spreadsheet gives me more confidence in our retirement plan. I’m pleased I based our plan on FIRECalc. I reject any use of the rules of thumb from the Updated 4% Rule. (Why are the statements of the Updated 4% Rule so far off? Read here for my views.)
========
The spreadsheet is a simple, dynamic tool to see the effect of Spending Rate, Investing Cost, and Mix of stocks and bonds. In an upcoming post I’ll provide the actual spreadsheet you can download. Some may want to use it to validate their plan decisions and play with it to explore the effect of different inputs.
Conclusion. We retirees can trust the results from FIRECalc for our retirement financial plan. We can set any number of years we desire for zero chance of depleting our portfolio. We input our decisions on Mix of stocks vs. bonds and Investing Cost into FIRECalc, and it leads us to the Safe Spending Rate (SSR%) that meets our choice of years. Most retirees are in the dark as to even knowing what the three key decisions are. Generalizations like the Updated 4% Rule aren’t helpful, and that Rule is just not correct in my view: follow that Rule at your peril.
* Buried in the details of the 4% Rule is the exact investment mix used, and I tried my best to match it exactly in FIRECalc. I used a mix of 55% stocks and 45% bonds. Stocks are 35% Large Company Stocks and 20% Smaller Company Stocks (an overweight). Bonds are as close to Intermediate Government Bonds as I can get in FIRECalc. We’ll find in other posts that this low mix of stocks is off the mark for your financial retirement plan.