How do your returns compare to those of bland index funds?
Posted on April 27, 2018
I’m a bit surprised that so few folks I know compare the performance of their investments to a very simple portfolio of index funds – what the market basically gives all investors. We Nest Eggers own just a few index funds, and we know we simply and consistently keep 98% of the aggregate return from the market. We invest in funds or ETFs like the ones I recommend in Nest Egg Care (Chapter 11 and Endnotes, Part 4) or from here or here. We have a winning strategy.
I find that many folks just don’t pull the trigger and switch to index funds. Inertia and inaction rule. To drive home the point on the advantage of index funds, take the time to compare your performance to the returns that the market gives all investors. One finds the returns for the S&P 500®, a common benchmark, but not returns for the Total Stock Market (US or International) or for the Total Bond Market. You have to work a bit to find those.
This post discusses two ways to compare:
1. Compare your return for 2017 with the return earned by Nest Eggers; we invest solely in total market index funds and basically earned what the market gave all investors. You can do this most simply by using an IRA account(s) where you did not add or withdraw in the year. That means you can clearly understand your return rate for 2017. It’s simply the percentage change in value during the year. (Fidelity®, my brokerage house, also reports 12-month returns for each account – correctly accounting for the effect of additions or withdrawals. It’s a more accurate comparison, though, to use accounts that had no additions or withdrawals.)
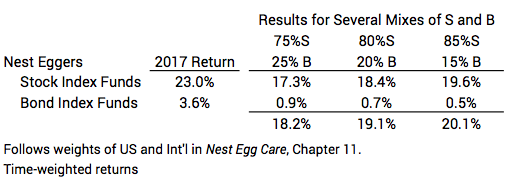
You should know or you can find your mix of stocks and bonds on January 1, 2017. You use that mix to find your personal benchmark: what you would have earned had you held index funds. You can see I reported total market returns of +23.0% for stocks and +3.6% for bonds here. You’d do the math to get your benchmark: for example, if your choice of mix was 75% stocks and 25% bonds, your personal benchmark for the year was +19.1%. You’d then compare: is this what you earned with your actively managed funds/stock and bond picks?
2. Start anew and run an experiment for a year directly in your own account(s). I like this choice. I think the results will be more convincing to you. That’s what my friend George did. His one-year experiment just ended March 31.
Last March George transferred a portion of his IRA funds to an account with an investment advisor. The advisor chose a mix of stock and bonds and weights for US and International for each. The advisor selected actively managed funds attempting to beat the market and was fully invested April 1.
George similarly transferred IRA funds to a new account at Schwab®. George invested in four index funds/ETFs to match the advisor’s mix and weights. (This restructuring to new holdings was simple for both the advisor and for George, since there are no tax consequences for sales in an IRA account.)
George’s four index funds/ETFs in turn own 17,000 securities. That’s a lot of diversification. He probably owns a greater number of securities than held by the greater number of actively managed funds picked by his financial advisor.
George did not add or withdraw from either account during the year. That made it simple to track account values quarterly and calculate the cumulative returns from the April 1 start.
You can see in this table that George (index funds) killed it! George beat the advisor by 4.5 percentage points. George earned 15.4% for the 12 months; the advisor earned 10.9%. That 15.4% is more than 40% better than the 10.9%. You can also see that George outperformed every quarter. (You can use this spreadsheet for your experiment.)

How important is that 4.5% underperformance? The advisor’s account underperformed by $4,500 for every $100,000 George had with him. If George started with $300,000 there, that would be $13,500 underperformance. And there is no logic that suggests he can recoup that. That’s very painful in my mind. I think of that as a two or maybe three-week trip to Europe for George and his wife. UGH.
Why did this happen? The difference in returns has to be a combination of three factors:
1. The active fund managers did not match the market before any consideration of their greater fund management fees. (As I describe in Nest Egg Care, before costs it’s a zero sum game for active funds managers. They’re just fighting among themselves: in aggregate all actively managed funds must match the market as a whole. For this 12-month period, the advisor’s active fund managers came up on the short end of the game of which active fund managers would pick winning stocks and which ones would have losers.)
2. The fund management fees for actively managed funds are greater than for index funds; one percentage point more than index funds would not be unusual.
3. The fee for the advisor is a reduction of what George gets to keep. I’m guessing that George incurred more than a one-percentage point fee for his advisor for the year.
Conclusion. You’re retired. Don’t try to beat the market. Just accept that you should predictably earn 98% of what the market gives all investors. It’s a winning strategy, and it’s a core ethic of Nest Eggers.
If you have not made the switch to index funds, you may want to see the evidence more clearly. Compare the result from your choice of actively managed funds or stocks to that of simple, bland index funds, similar to those owned by Nest Eggers. You may not see as dramatic a difference in 12 months that George saw, but my guess is that you will see a difference. While many actively managed funds do beat index funds in a year, most do not, and in aggregate they average more than one percentage point less. My guess is that your mix of actively managed funds will succumb to the rule of large numbers: you will converge on the expected results that actively managed funds will underperform index funds.